

I’d like to closely track my portfolio returns, see how it evolves over time, and compare it to a benchmark like the S&P 500. But did you know there’s much more to measuring returns than meets the eye?
I’ll be using my 2025 portfolio returns as an example to explain the intricacies of measuring performance. Understanding these nuances is important for every investor because the type of calculation you use can drastically change the outcome.
Can you tell from the graphs below which one shows my actual return for 2025?
- Option A: Calculation 1
- Option B: Calculation 2
- Option C: Calculation 3
- Option D: Calculation 4
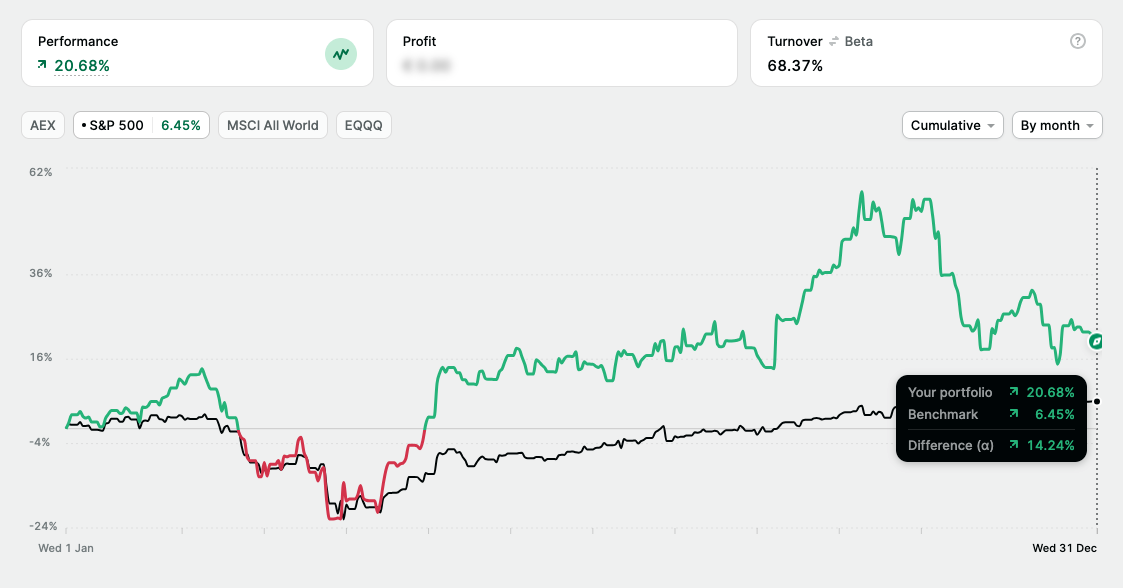
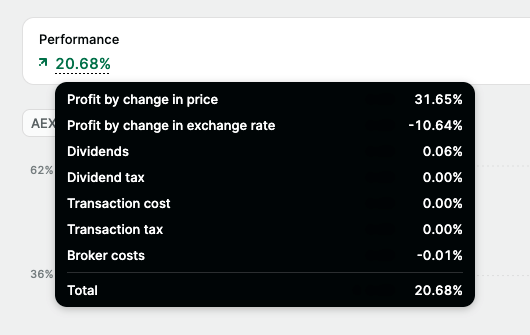
Calculation 1: Money weighted rate of return (+20.68%)
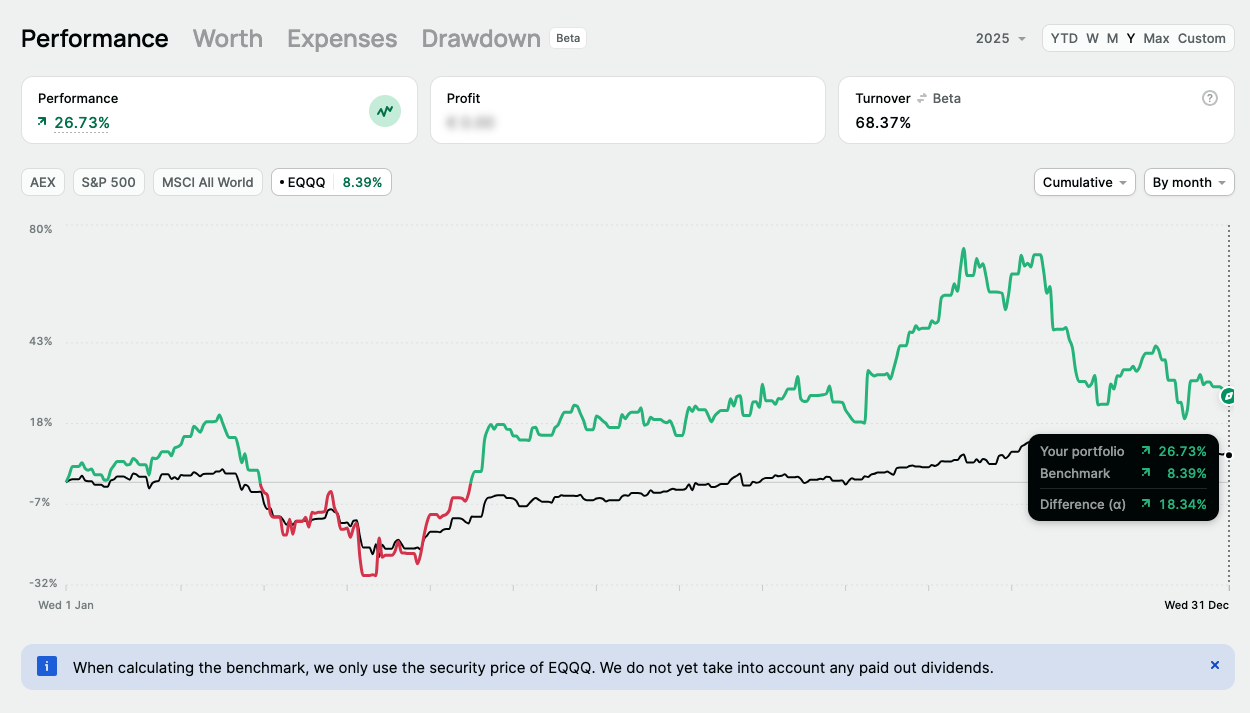
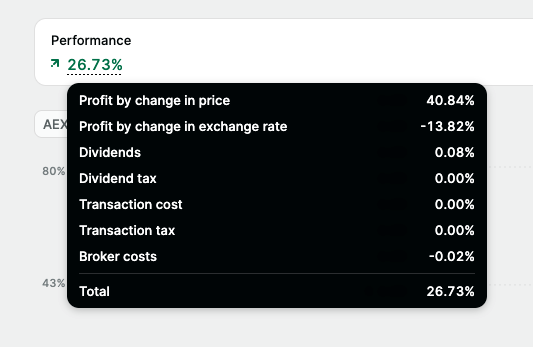
Calculation 2: Absolute return (+26.73%)
Calculation 3: Profit by change in (stock) price, based on Money-weighted rate of return (+31.65%)
Calculation 4: Profit by change in (stock) price based on absolute returns (+40,84%)
Answer: all of them are correct, because all of them show my 2025 return. Just with different but important nuances. Let me break it down and explain which type of performance calculation I personally think is best.
1 - Money weighted rate of return (MWRR)
MWRR measures how your portfolio actually performed based on when you added or withdrew money. In other words, it factors in the timing of your investments.
It includes:
- How much money you invested
- When you invested it
- When you withdrew money
If you’re tracking your portfolio, MWRR often gives the most realistic picture of how you did because it reflects your real capital allocation decisions, not just what markets did in the abstract. In my case, my 2025 performance based on MWRR is +20.68%.
Pros
- Most realistic for personal portfolios because it reflects when you actually added or withdrew money
- Great for measuring your decisions as a capital allocator, not just market movement
- Useful if you contribute monthly, buy dips, trim winners, or move cash around
- Harder to game with cherry picked start dates, because timing is part of the story
Cons
- Not ideal for comparing yourself to an index, unless you also model the same cash flows into that index
- Can look worse or better mainly because of contribution timing, which can confuse readers
- If you made a big deposit right before a drawdown, MWRR can look brutal even if the portfolio is fine long term
- Can be harder to calculate and explain, depending on the tracker or broker
Now let’s look at absolute returns.
2 - Absolute returns
Absolute returns show how much your portfolio grew or shrunk in total, without factoring in timing, contributions, or withdrawals.
Think of it as:
- Simple: total % gain or loss
- Timing blind: 1 month or 10 years is treated the same
- Useful for: a straightforward profit and loss snapshot
Based on absolute returns, my portfolio performance is +26.73%. The absolute return calculation is used by most brokers and stock tracking tools, including many self built Excel sheets.
Pros
- Simple and intuitive. It answers: how much am I up or down in total
- Easy to communicate and sanity check
- Good for tracking progress toward a goal like turning $X into $Y
- Works well when there were no contributions or withdrawals, or very few
Cons
- Ignores timing completely, so it can misrepresent the skill or quality of your decisions
- Not great for portfolios with regular deposits or withdrawals because it mixes performance with savings behavior
- Easier to mislead unintentionally, because two people can report the same absolute return with very different experiences
- Makes comparisons across different time periods tricky unless you standardize the window
3 - Factors influencing returns
Aside from actual stock performance, there are a number of factors that influence your return. These are hidden costs most brokers do not show, but they can significantly impact your overall returns. Think of:
- Exchange rates
- Transaction costs (and tax)
- Broker costs
In the example below, you can see what this looks like for my 2025 performance. The first one is the MWRR overview and the second is absolute returns. See how much exchange rate affected my performance?
That’s because I live in the Netherlands (euro) but I invest mostly in the US (dollar). The dollar decreased quite a lot in value compared to the euro, directly impacting my portfolio.
I won’t go into detail on all these factors, but it goes to show there are a lot of moving pieces. If you trade a lot, transaction costs can potentially hurt your returns quite a bit. And dividend tax can pressure a portfolio with a lot of high yielding dividend stocks.
Conclusion & personal preference
It’s important to be aware of the intricacies of portfolio returns, especially when comparing your returns with others or against benchmarks. It also shows how easy it is to selectively share the most convenient performance calculation.
If I wanted to boast about my 2025 returns, I could show my absolute return excluding exchange rates (+40.84%). But the most factually complete return calculation is MWRR including exchange rates (+20.68%). See how much of a difference it makes?
Personally, I like to use MWRR excluding exchange rate to get the best overall idea of how I did as an investor. Why exclude exchange rate? I can manage which stocks I pick, when I pick them, how much cash I hold, how many transactions I do, and so on. But exchange rate is beyond my control, and it doesn’t say much about how good of an investor I am.
To conclude, my portfolio returned 31.65% based on MWRR, excluding exchange rate ("FX neutral"). In my view, this is the cleanest way to look at my returns as a result of the decisions I’ve made as a capital allocator, while ignoring the impact of currency fluctuations.
The tool I use to track my portfolio (and the screenshots you see in this post) is Portfolio Dividend Tracker, which I’ve been using for many years now. It’s the best tracker I know of. If you'd like to know more about it, you can check the link below.
As always, none of this is financial advice. This is simply me view on portfolio measuring portfolio returns. Always do your own due diligence before making an investment decision that fits your own risk tolerance and time horizon.
Written by

Sign-up
And receive the latest visuals and articles straight to your inbox


Member discussion