
Partners
I am very selective about which platforms I partner with, and when I do, it’s because they’re a vital part of my own investment process and I genuinely think they can help you too. I’ll briefly walk you through each one, what I like most, and how I use it.
Fiscal - Financial data
What I like most about Fiscal
Reliable, accurate and up-to-data data is crucial when researching stocks. Fiscal does not only offer that but presents it in very easy to digest charts as well. Which I obviously love as a visual learner myself.
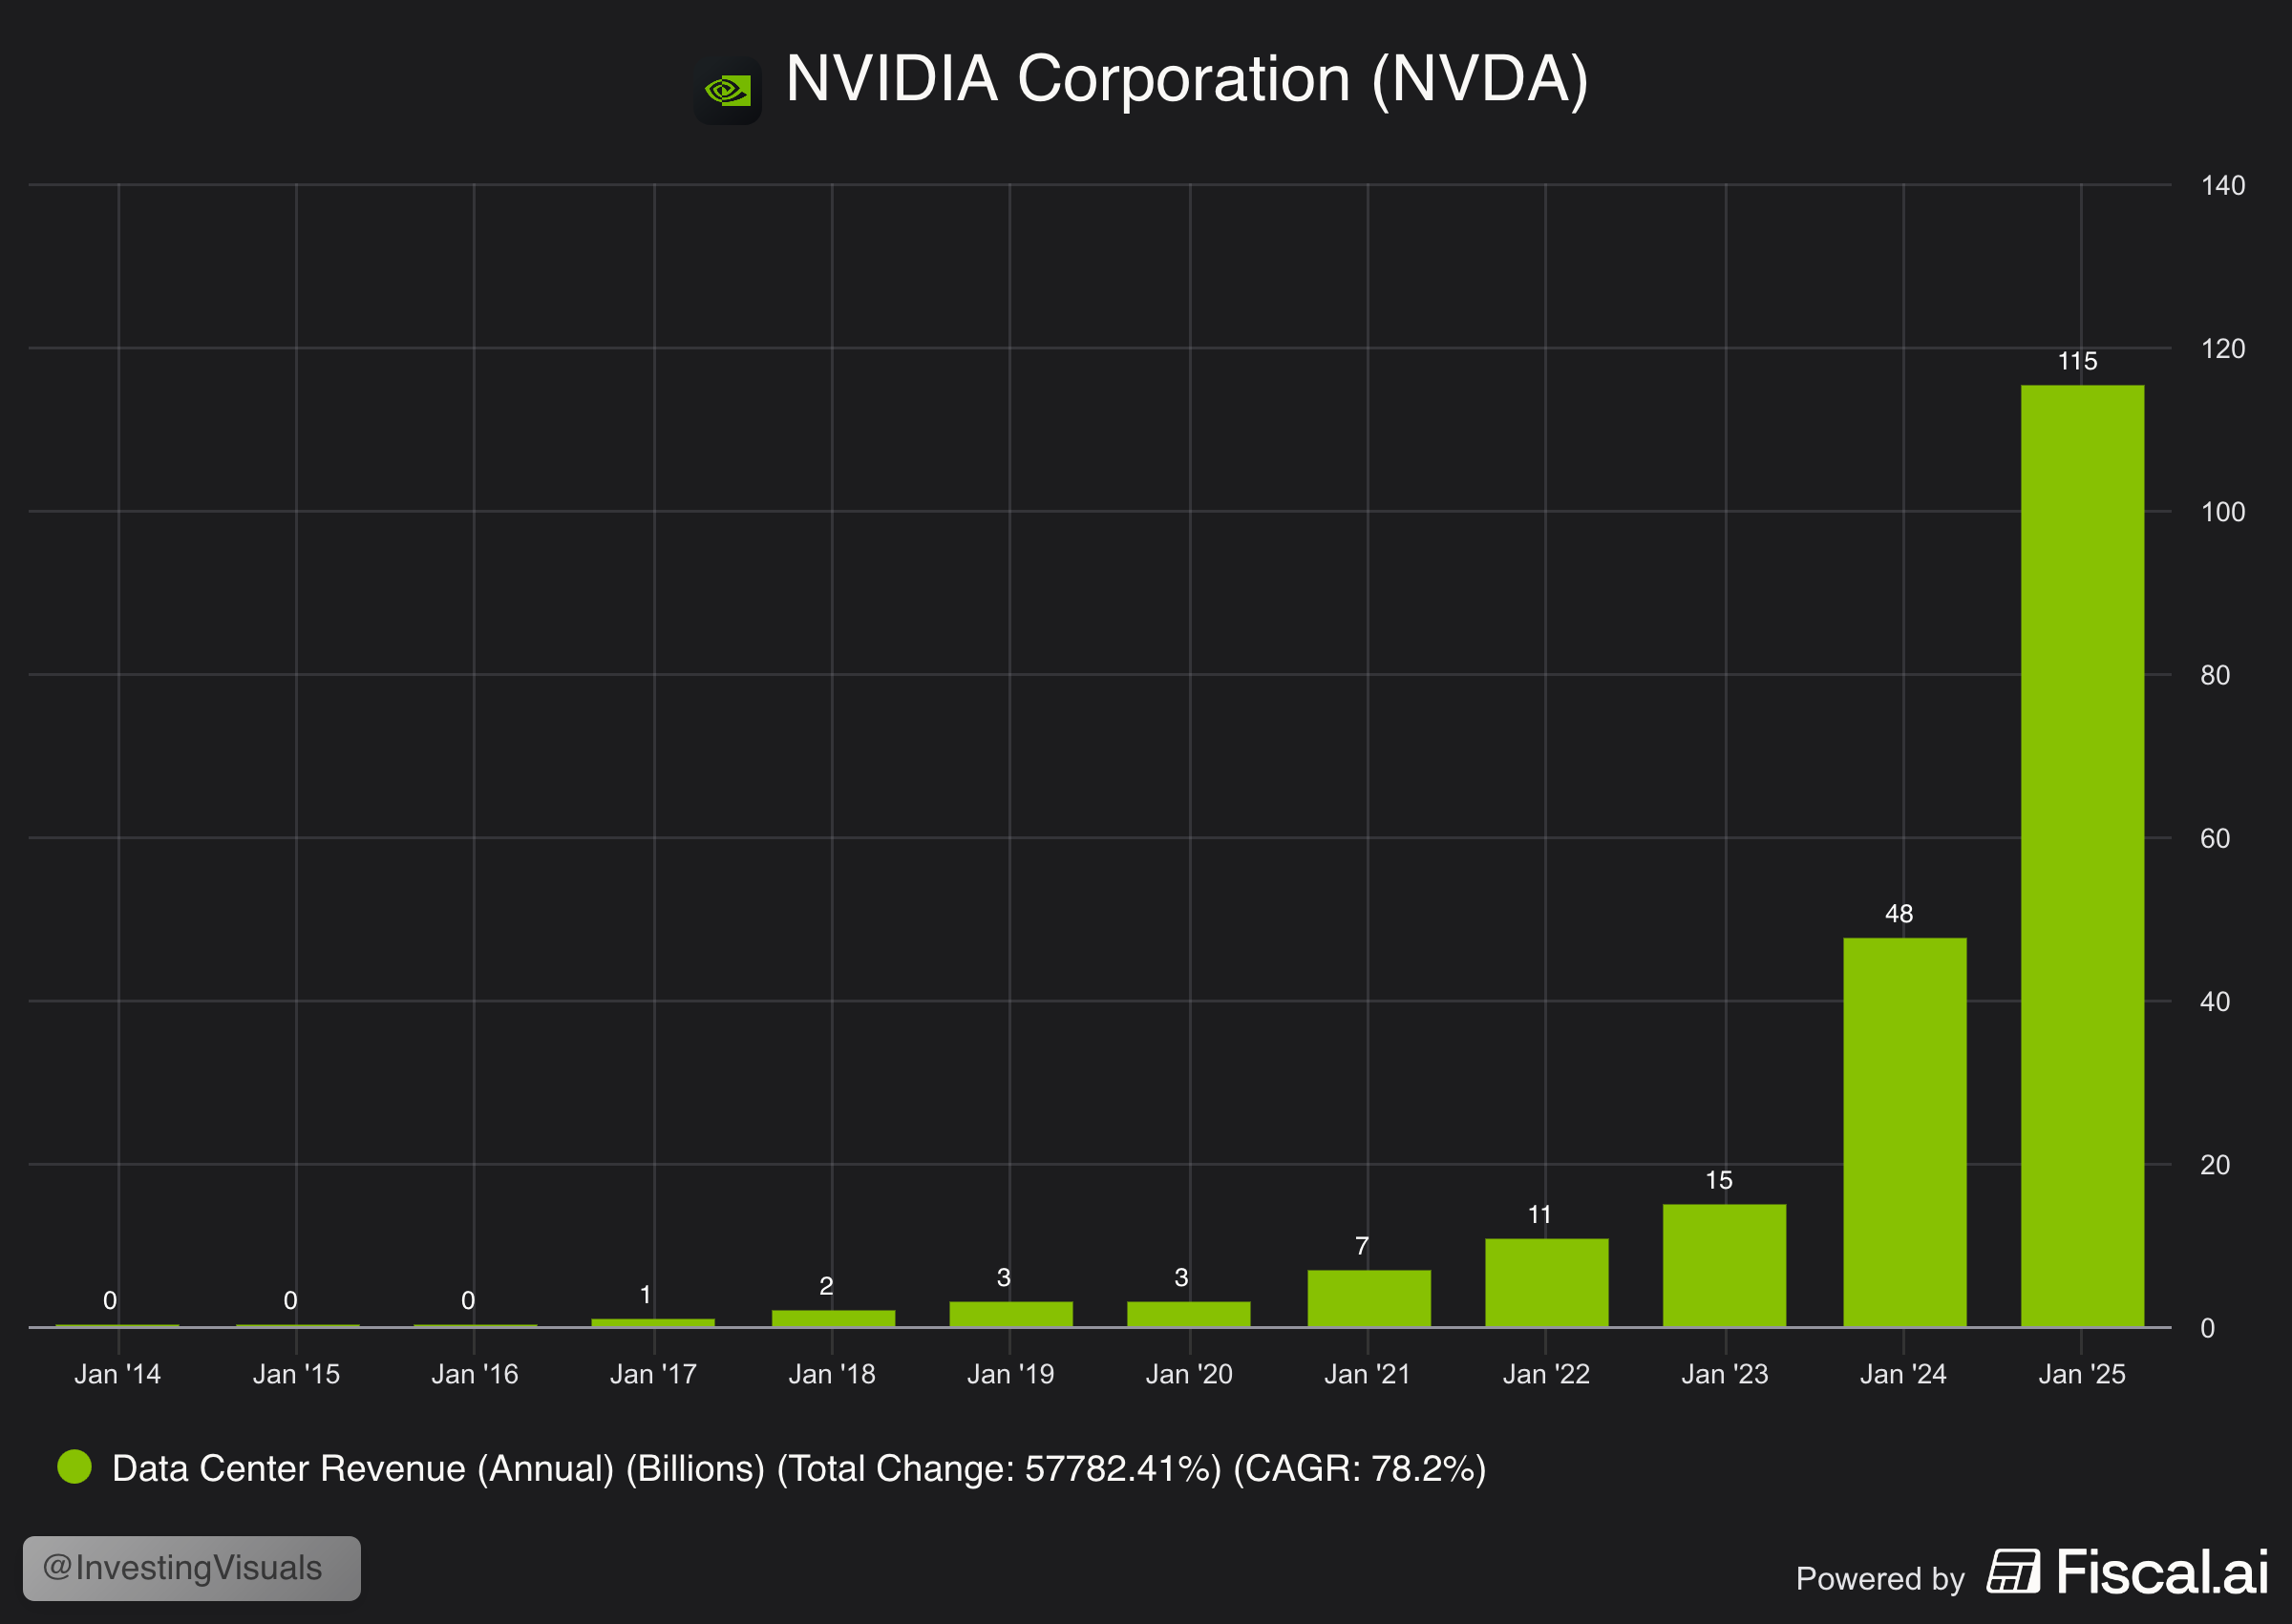
One of their key features that really distinguished them from other platforms is business specific data on segments and key-performance indicators. Let's take a look at NVIDIA for example. This overview shows their data center revenue growth over the past 10 years.
How I use Fiscal
I basically use it for everything. Research, staying up-to-date on businesses that I invest in, collect data for visuals, listening to earnings call (and let AI summarize them), create custom charts, dashboard and gain access to 15+ years of historic data.
Do I pay for it?
Yes I do. Or at least; I used to. I don't often pay for tools but Fiscal was one of them. Because I've partnered with them, I no long pay for a subscription, but it was worth every penny so far. It really helps me to make data driven investment decisions.
If you'd like to try it out for yourself, you can get a 15% discount on any paid plan with the link below.
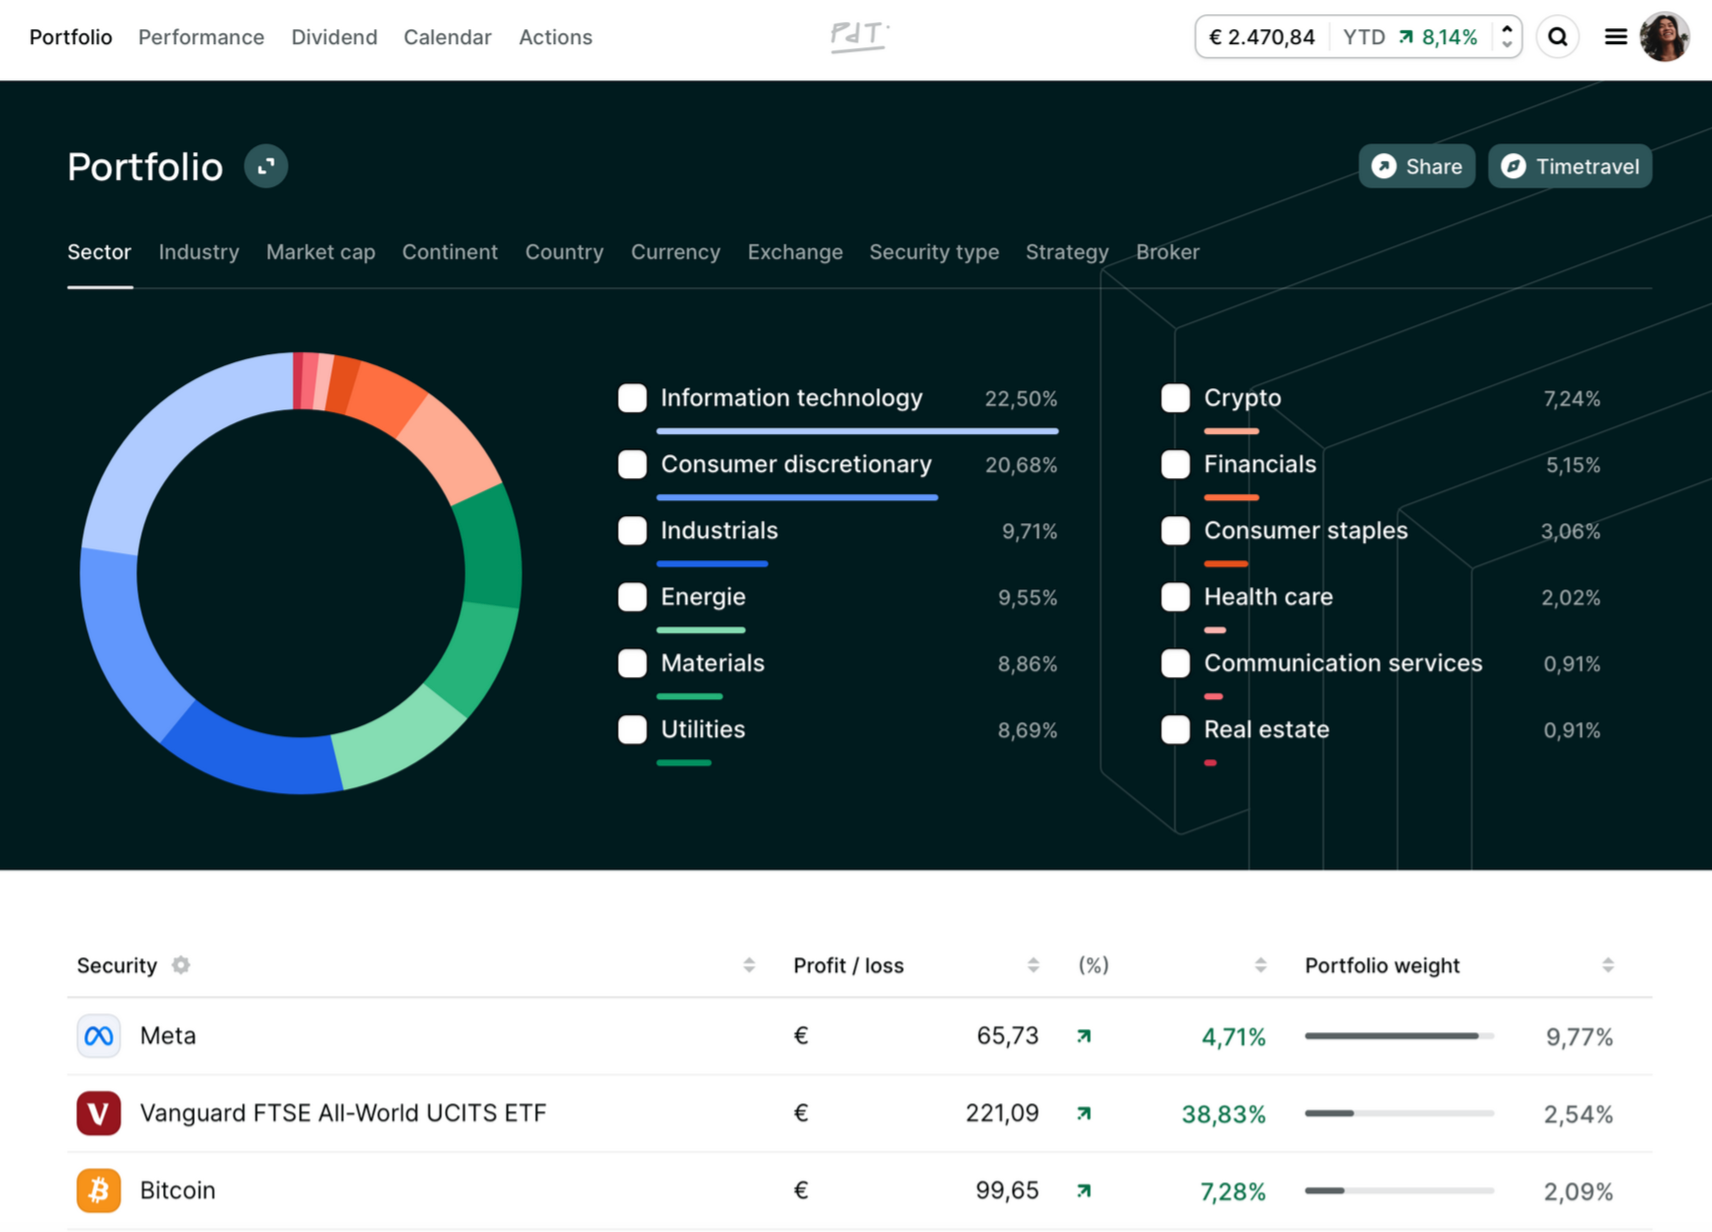
Portfolio Dividend Tracker (PDT)
I can't stress it enough: this is a must-have for every investor. It's a tool to track all my portfolio key metrics and gives me full insight into both my current and past actions, performance (vs indexes), dividend payouts and much more.
What I like most about PDT
This give me the most purest form of data-driven portfolio insights. There are numerous features that I like, but let me focus on my top 5:
- Return contribution: shows how much each of my positions contributed to my returns in any given time frame (weeks, months, years etc.)
- Timetravel: allows me to travel back in time and see what my portfolio looked like back then
- Actions: tracks all my actions based on broker imports and if they positively or negatively contributed to my performance
- Closed positions impact: shows whether closed positions did better or worse versus my overall portfolio performance
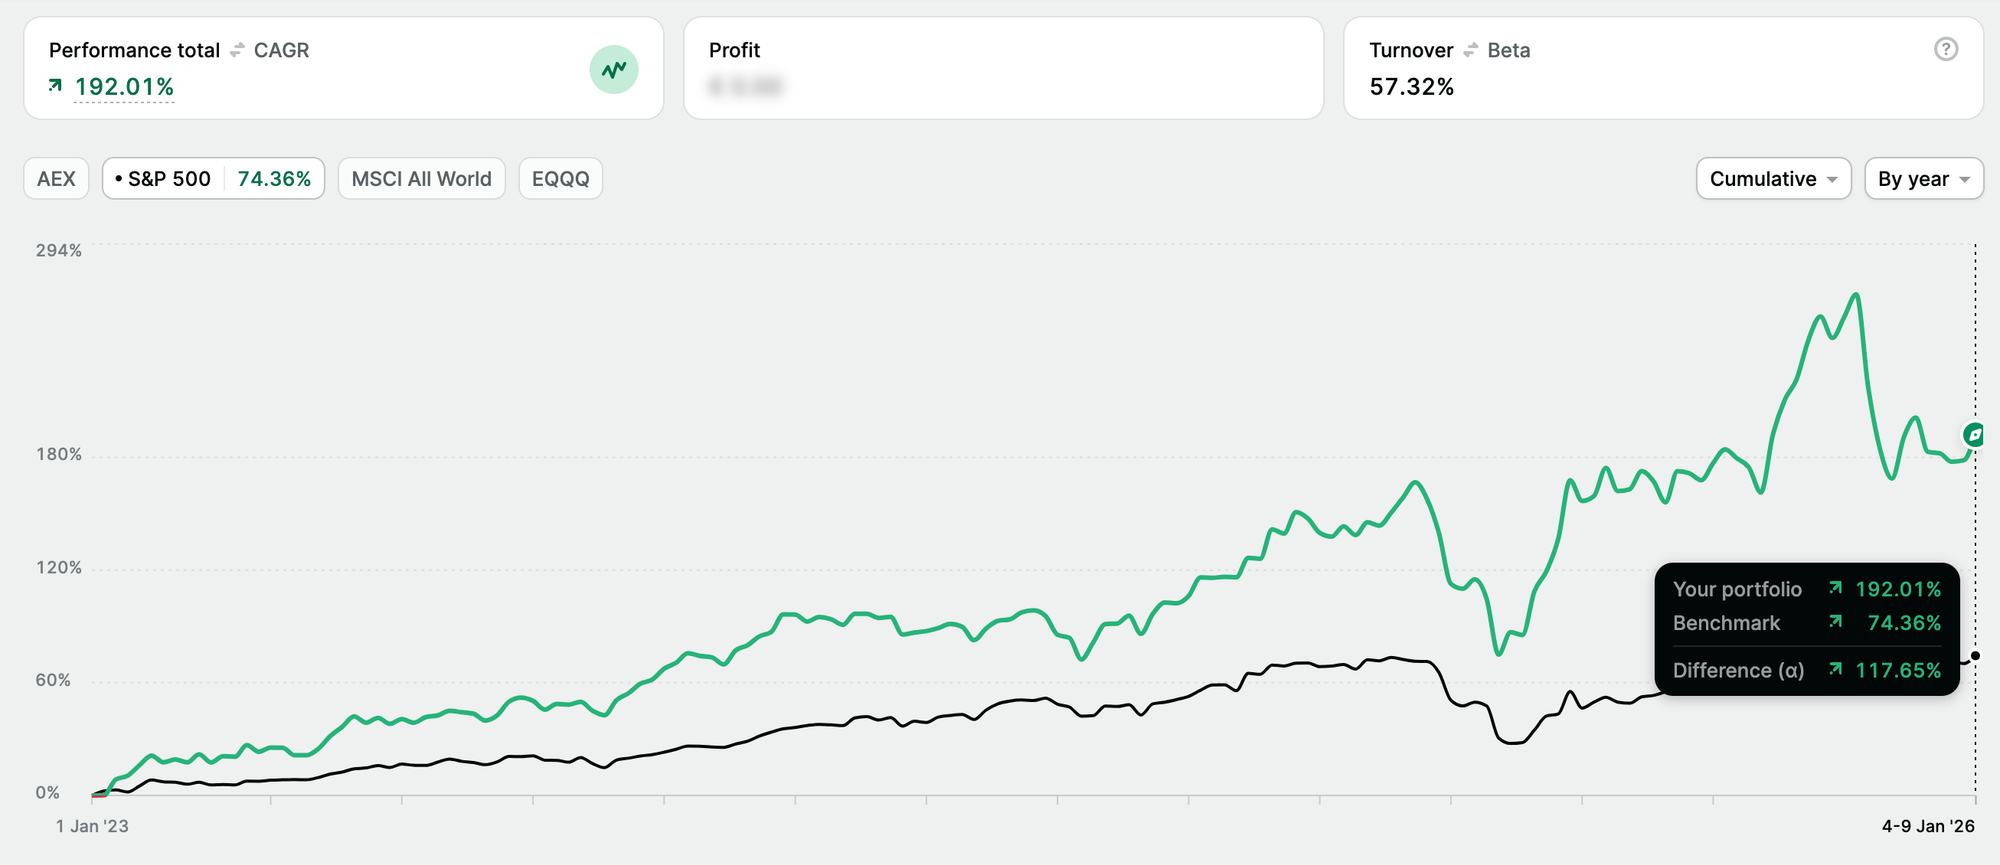
- Performance vs index: highlights how my portfolio performed versus major indexes such as the S&P 500 and the % of under-or out-performance
There are many more great features but these are the ones I'd like to highlight. Below is an overview of my portfolio performance vs the S&P 500, to give you an idea what it looks like.
How I use PDT
Everything portfolio related is linked to PDT. I use it to check the performance of my holding, relative weight, cost basis, performance over time, best and worst performers, if closing a position was a good move or not, how much transaction fees I've paid and how much dividends I've received.
In short: everything portfolio related.
Do I pay for it?
Yes I do. Or at least; I used to (same as Fiscal). Because I've partnered with PDT, I'm now an "Ambassador" and can use it for free. But every penny I've spend on it was worth it. If I had to cancel all my investing related subscriptions, this would be the last to go.
If you'd like to try it out for yourself, you can get 15% off your first payment with the code 'JAN15'.