

Premium and Platinum tiers
Using AI to become a better investor
I'm always looking to improve myself as an investor, and recently AI has become an important part of that too. I was genuinely surprised by all the possibilities. In this article, I'll share what I found and how you can leverage AI to become a better investor too.

Introduction
I recently connected my portfolio tracker to Perplexity (my go-to AI tool) and let it analyze my entire portfolio and history: every position, all my buys, sells, deposits, and withdrawals over the course of many years. My main goal was to use these insights to learn and grow as an investor.
Key focus points:
- My strengths and what I should keep doing
- My weaknesses and what I should be aware of
- How I evolved over time as an investor
The answers were quite surprising, and actually beyond what I expected.
Let's first dive into what it found, and after that I'll lay out how you can do this with your own portfolio too.
1 - Strengths: what is working
Everything in quotes is directly from the report Perplexity gave me, including the headlines. The rest is my own context and thoughts on the analysis. From here on, I'll just call my AI assistant Jarvis.
1.1 Conviction sizing on winners, held long enough to compound
What Jarvis had to say about this:
The single clearest strength in this book is the willingness to let a strong thesis run in size rather than trimming too early. Nebius is the standout case: first buy February 3 2025 at USD 32.08. Today's close is USD 187.97, a 486% increase from that first entry. Axon is another one. First buy January 10 2022 at USD 142.26. Today's close is USD 571.01, a 301% increase. This is a four-year hold that has compounded through an entire market cycle, including the 2022 drawdown.
It continued:
It's a pattern: identify a structural thesis (AI infrastructure, GPU compute), size into it meaningfully, and don't sell the moment it becomes profitable. That patience is rare and it is the main engine behind the 178.67% of alpha versus the benchmark.
Don't make me blush now, Jarvis!
Jokes aside, it did hit the nail on the head. I try to identify structural shifts early and position accordingly, then let my winners run. I learned this the hard way, by the way. I had plenty of losers too, but we'll get to that.
1.2 Buying into fear rather than euphoria, when discipline holds
What Jarvis had to say about the way I 'play' the market:
The best closed trades in the ledger share a common origin: they were opened during clear drawdowns rather than during hype cycles. Cloudflare and CrowdStrike, both entered in the 2022 tech selloff, became two of the largest realised wins in the entire history. Adyen, bought when European fintech sentiment was at its worst, and Veeva Systems' first tranche, held from 2022 to 2025 for a clean 24.3% product gain, both reinforce the same lesson.
It finishes by noting:
When entries are made on valuation and drawdown logic rather than on momentum, the outcomes are consistently strong. This is a repeatable, teachable skill, not an accident of timing.
This is something I learned over time. I used to buy high and sell low based on nothing but gut feeling. That changed a lot over the years, and I'm genuinely happy to see the data supports it.
It's also what I try to teach investors in our community: to be patient, to strike when the time is right, and to sit tight during a major sell off. After that, you can reap the benefits as the market recovers.
1.3 Willingness to exit a broken thesis instead of anchoring to a cost basis
I find it pretty interesting that it came up with this point as well. I've had several bad calls (we all do), but it's great to see the data shows I'm not afraid to take a loss and move on. For context: I've closed 53 positions in total over this 7 year period, and 46 of those 53 performed worse than my overall portfolio.
Meaning they would have been a drag on my performance if I'd held on to them. "Cut the weeds and water the flowers" a wise man once said.
Several closed positions show a healthy pattern of cutting losses at a reasonable size rather than doubling down to defend an entry price. Duolingo, Alibaba, and Upstart were all closed out fully rather than held indefinitely waiting for a recovery that may never have come. The losses on these names are real, but they are bounded. A portfolio that never sells a loser eventually accumulates dead capital in names that go nowhere. This book does not have that problem, and the closed-position count of 53 versus a much smaller number of currently open names shows an active willingness to recycle capital out of ideas that stopped working.
1.4 - Sector and thematic focus without single-stock dependency in the current book
This is another interesting one, about how I build my portfolio around certain themes I firmly believe in without over concentrating:
Despite Nebius being the largest position, the underlying current holdings collectively express a coherent thesis around AI infrastructure, semiconductors, and enterprise software, rather than being a random assortment. That thematic consistency means the research effort compounds. Understanding one name in the AI supply chain builds intuition transferable to the next, and the results across this cluster. Several positions are showing strong double or triple digit total gains percentages, suggest the thesis itself is sound, even where individual entry timing was not always ideal.
I really like that last point: my entry timing wasn't always ideal, but it still translated into very strong returns. It shows why simply starting a position can work, even if it isn't the best entry price I'll get along the way.
1.5 - Turning a loss into an eventual profitable exit when the story genuinely changed
On positions that at some point were loss making and eventually turned around:
Ouster is worth calling out specifically: opened, partially exited at a 61% realised gain, and the remaining shares are still up 46.7% unrealised. When the price dropped, add again and let it compound. Similar cases reflect a willingness to reassess a name after new information arrived and add back in when the setup genuinely improved, which is a more sophisticated behavior than either rigidly holding or rigidly avoiding a name after a rough start.
While the analysis labeled OUST as a "reassessment" case, that's not entirely accurate. After I bought it, the stock ran nearly 80%, so at some point I trimmed it down. That was purely based on valuation, not on new information coming in. After the stock dropped on sentiment, I added again.
Upgrade to premium to gain access to my full portfolio, transaction history, full content library and a great community to learn and grow with.
2 - What to preserve going forward
What Jarvis had to say about what I should keep doing:
- The instinct to size meaningfully into a small number of high-conviction ideas
- The discipline to buy into fear rather than hype when that discipline is applied
- The willingness to close out a broken thesis rather than anchor to a cost basis
None of the fixes below are about suppressing these instincts. They are about applying the same rigor that already worked and about making the Nebius style conviction sizing a deliberate, monitored decision rather than something that grows unmonitored simply because the position kept winning.
3 - My weaknesses
Onto my weaknesses; what are area's I can improve?
Jarvis starts with "Here's where I have to be honest, because flattering yourself in public is easy and useless." Well, that sets the tone, doesn't it? 😆 But fair point. This is about transparency and learning, not flattery. Let's dive in.
3.1 Weakness 1: currency drag is a live cost, not a historical footnote
Lifetime FX movements have cost the portfolio just over 10% of total realised and unrealised gains combined, and the drag is still accumulating on the open book right now. USD-denominated holdings make up 85.1% of the entire portfolio, so this is not a marginal exposure, it is close to the entire book riding on a single currency pair.
True, and it's something I'm very much aware of. I live in the Netherlands, so our currency is the euro, and the dollar has declined significantly against the euro over the years.
The thing is, the best in class businesses are in the US and listed on the NASDAQ. But it's something I'll review more closely, to see whether I can shift some of my positions to EUR listed holdings and reduce currency risk.
3.2 Weakness 2: Concentration has only intensified
This is an interesting one because it contradict the earlier point about what I should keep doing (The instinct to size meaningfully into a small number of high-conviction ideas):
The current open book shows concentration risk has gotten sharper, not softer, even though it is being built on top of genuinely strong entries.
The top five positions now account for 57.6% of the entire portfolio. The first buy lens on Nebius makes the picture sharper still: the earliest shares are up nearly sixfold, and every one of the additional buys made since that first purchase was executed at a materially higher price. That is not simply a winning stock, it is a position that kept getting bigger as it kept getting more expensive.
Concentration built from an early winner that was then aggressively added to at higher and higher prices is a different risk profile than concentration built from a single upfront conviction bet, and this book has effectively built both at once.
It's true that my initial NBIS buy is up nearly 600%, and I continued to add as they executed. It's a deliberate decision to double down at higher prices, at times aggressively, including when the stock dipped materially. This is exactly my strategy: lean into winners and cut the losers. But it does come with concentration risk. That's a deliberate choice though.
3.3 Weakness 3: The growth overreach pattern is still present, just more recent
Two of the fourteen live entries are showing losses right now, and both were opened within the last ninety days. Both entries came in size, both came recently, and both are currently underwater. The skill of the first entry is real. The habit of diluting that skill by adding size during enthusiasm rather than during pullbacks is the same signature behind the losses today.
As to the first point: Jarvis is entirely correct that I didn't time those perfectly, but I think a 90 day time frame is far too short to draw real conclusions from.
On diluting my entry, that's a direct effect of adding to winners even at higher prices. There are plenty of examples where a stock never reached my entry price again. But I did add on drawdowns, even when that was above my entry price.
One important thing I did change recently is that I now take larger entries. I now always initiate a position with at least 3% weight and build from there.
3.4 Weakness 4: Structural concentration beyond individual stocks
Jarvis on other forms of concentration: "Several weaknesses sit above the level of any single position and are easy to miss when looking stock by stock."
Sector concentration is extreme. Information technology alone makes up 71.9% of the portfolio, and within that, software specifically accounts for 47.2% on its own. Industrials cover the remaining 28.1%. There is no exposure at all to healthcare, consumer staples, energy majors, utilities, materials, or traditional financials as standalone sectors.
Single broker, single point of failure. 90% of the portfolio sits with one broker (DEGIRO). There is no operational diversification across custodians.
No dividend or income layer at all. The portfolio is entirely dependent on price appreciation for returns, with no income cushion to soften a drawdown or compound independently of price action.
My technology concentration is deliberate, because it's what I know best. In 2022 I chose to focus fully on tech rather than anything else, because I believe the risk of investing in industries I'm not familiar with is greater than concentrating in one I know inside out.
The single broker point is genuinely a good one, and something I recently addressed by opening an Interactive Brokers account to spread broker risk.
No dividend income is a logical consequence of the type of stocks I own, which are early in their lifecycle and therefore don't pay dividends. I'm perfectly fine with that right now.
4 - How the pattern has evolved
I really like this part: I asked Jarvis to also include a section on how things evolved over time. Maybe you can plot yourself somewhere in this timeline as well?
2019-2021, the scattergun phase: broad, small positions across many names with limited conviction sizing.
2021-2023, the growth overreach phase: larger checks written into momentum names near their sentiment peaks, several of which became the largest realised losses in the closed-trade history. Axon and ServiceNow were both first bought in January 2022, right at the start of that difficult stretch, and both were held through it rather than sold at the bottom, which is itself worth recognising as disciplined behaviour that ran counter to the broader pattern of that era.
2024-2026, the concentrated AI conviction phase: fewer, larger positions in semiconductor, infrastructure, and enterprise software names, where first entries were frequently excellent (Nebius +486%, AMD +296%, Axon +301% from first buy), but the discipline around adding to those positions at higher and higher prices reintroduced the same weakness seen in two of the newest additions.
The stock picking has clearly improved and the evidence for that is concrete: triple digit percentage gains from first entry on the largest positions in the book. But the habit of continuing to add size as a name gets more expensive, rather than waiting for pullbacks to add, has not fully closed.
The biggest change compared to my scattergun approach in 2019 to 2021 is that I now run a much more concentrated, conviction based portfolio. Letting winners run and actually adding to them as they execute, even at higher stock prices. While Jarvis labels it as 'a name gets more expensive', that's only true for the stock price. A quick example:
- I bought NBIS at ~$32 when they traded at 12x forward EV/Revenue
- I also bought them at $83 at 10x forward EV/revenue
So while the stock price was higher, the actual valuation was lower. If I simply wanted to 'protect' my initial buy price, I would've missed the 200% run from $83 to $185 today.
My takeaway
I found this analysis genuinely helpful, both for breaking down my strengths and for the critical review of where I could improve, or at least pay closer attention. It's a great way to take a step back and reflect on my portfolio and investment style.
Aside from this analysis, there are so many possibilities to drill down into the actual data of my portfolio. So I will definitely build on this and experiment with other interesting ways to get valuable portfolio insights. Which I'll also share in some follow-up posts.
Do this for your own portfolio
In the steps below, I've outlined how you can set this up for your own portfolio. I think it'll take you roughly 15 to 20 minutes.
Step 1 - Portfolio tracker setup (10 min.)
I use this platform as my Portfolio tracker. It's how I keep track of all my positions, weightings, performance, and much more. You can start a 7 day free trial and if you like it, you can use the code "JAN15" to get 15% off your first payment.
I genuinely think it can improve your performance, because it gives you so much insight into your portfolio that you can act on. It's the last tool I'd cut if I had to get rid of everything I use.
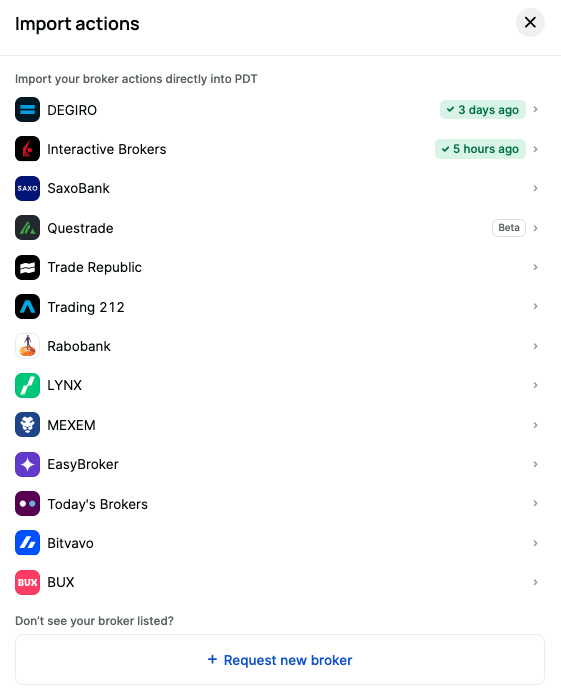
You can easily import your entire transaction history from a wide variety of brokers. Below are the ones they support right now, and you can request a broker if yours isn't on the list.
Importing your broker data to the tracker is quite self explanatory; once you click your brokers, there's a step-by-step guide on how to set it up.
Step 2 - Link to an AI tool (2 min.)
Right now, Claude, Mistral, Grok and Perplexity are supported as AI tools. Once you have the portfolio tracker set up and your positions loaded from your broker, you can use this short guide to connect them. It took me about 2 minutes to set up.
Step 3 - Talk to your portfolio
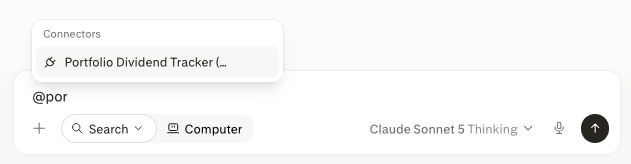
Once connected, I can simply type @Portfolio Dividend Tracker and ask whatever question I'd like. I can basically talk to my portfolio, which is really awesome. The possibilities are endless:
Example questions
- Analyze my three best buys over the past year
- Create a weekly recap of my portfolio with stock price increase/decrease, position weight and performance vs the benchmark
- Create a dashboard what I can see all my transactions over the past month, year and since inception
- Which positions have the largest weight in my portfolio?
- What costs have I made this year?
- Visualize my buy and sell history for <TICKER> and plot it on the stock chart
If you like to recreate the report I created for this article, you can copy and paste the prompt below into your AI tool and you'll have a full analysis in no-time.
Recreate the strengths & weaknesses report
AI prompt to create this report for yourself
Analyze my full investment portfolio history using @Portfolio Dividend Tracker. I want a deep analysis covering:
- My strengths as an investor, backed by evidence (e.g. benchmark comparison, not just gut feel)
- My weaknesses, named precisely (behavioral patterns, concentration, currency exposure, exit discipline, cash/withdrawal decisions)
- A timeline of how my investing behavior evolved across distinct phases
Before starting, ask me clarifying questions about intended outcome, time horizon, and focus area. Then produce it as a report.
And that's it for today. I hope you found this helpful and feel free to drop a reply if you're stuck somewhere or have other questions!
Upgrade to premium to gain access to my full portfolio, transaction history, full content library and a great community to learn and grow with.
As always, none of this is financial advice. This is simply me reflecting on my portfolio and sharing my thoughts. Always do your own due diligence before making an investment decision that fits your own risk tolerance and time horizon.
Written by

Subscribe to keep up to date
Subscribe to get regular updates. No spam, unsubscribe anytime.







Member discussion